Dr Alan Maddison, April 2018
Though the Jewish vote represents only about 0.4% of the population, its impact may be significant in some constituencies where the Jewish population can reach up to 21% of the total.
In addition to the dominant non-Jewish white vote, the vote of other ethnic minorities may be very important in these constituencies where their share of the population can be up to almost 60%.
In this article we analyse the performance of the Labour and Conservative parties in the 10 constituencies with the highest Jewish votes for the general elections of 2010, 2015 and 2017. We also explore the possible impact of the Black, Asian and Minority Ethnic (BAME) votes in these 10 constituencies.
1. The performance of the Labour and Conservative parties in the last three general elections
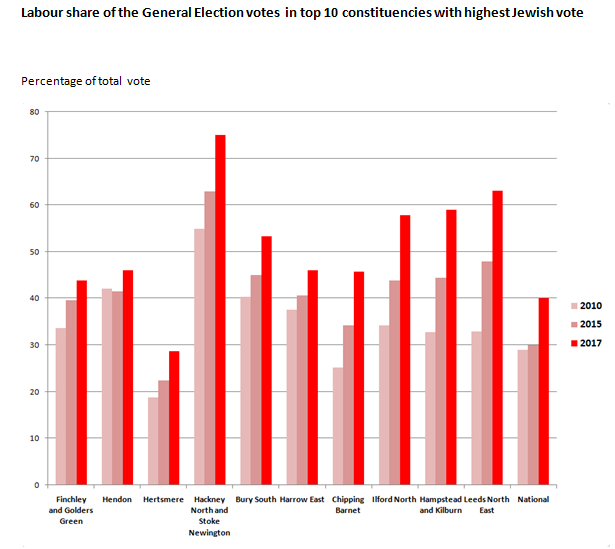
Labour has increased its share of the vote in all of the 10 constituencies with the highest proportion of Jewish voter since 2010 (1, 2).
More recently, the average growth of Labour’s share of the general election vote between 2015 and 2017 in these constituencies was 9.6%, exactly the same as at a national level.
Labour general election vote shares in top 10 Jewish constituencies
Vote share (%)
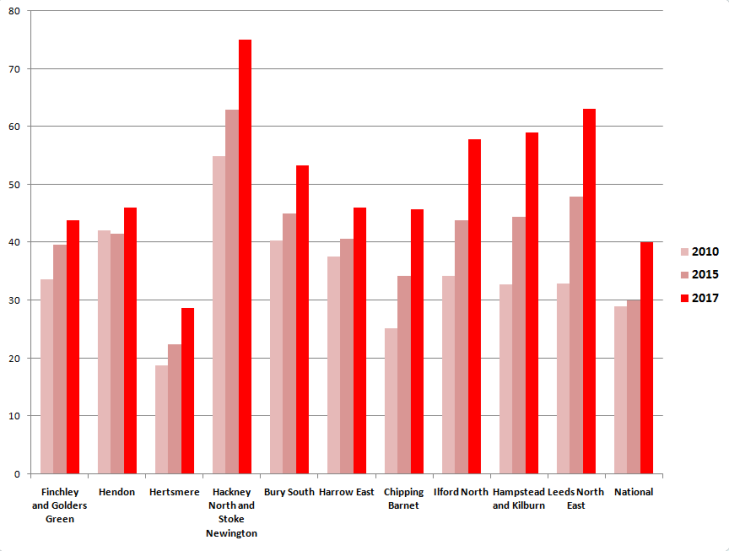
Finchley & Golders Green, and Hendon, are the two constituencies with the highest Jewish populations of 21% and 17% respectively. In both the increase in the Labour vote share of 4.1% and 4.5% in 2017 was lower than the national average of 9.6%. But in these two, and in a total of nine out of the ten of these constituencies, the resulting Labour vote share in 2017, as can be seen above, exceeded the 40% national average.
However, in contrast to the 5.2% average growth in the Conservative Party share of the national vote between 2015 and 2017, in these 10 constituencies there was an actual average fall of 1.5%, a fall which was also recorded for Finchley & Golders green and Hendon, as shown below.
Conservative general election vote shares in the top 10 Jewish constituencies
Vote share (%)
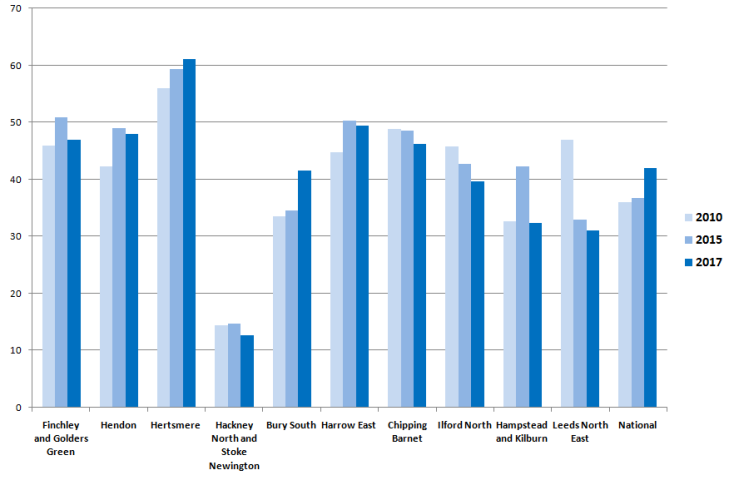
We see above that the Tory share of vote between 2015 and 2017 fell in all but two of these 10 constituencies, against a national increase.
Taken together the net national shift towards Labour was + 4.4%, but the average shift for these 10 constituencies was more than double this +11%, as illustrated below.
Net gain in Labour share of General Election votes between 2015 and 2017
Net gain in Labour vote share (%)
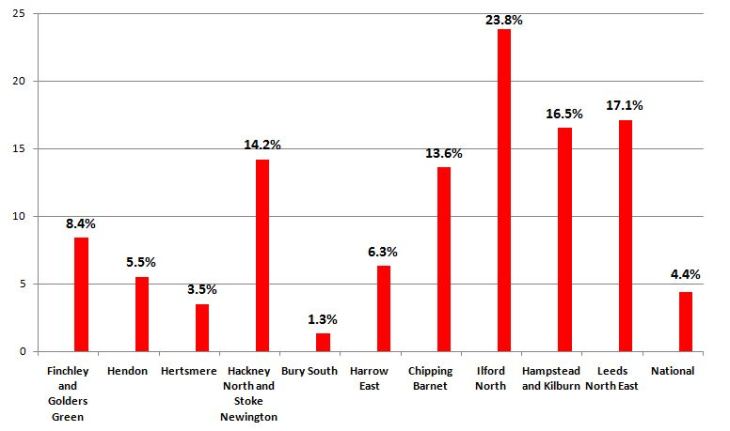
From the above illustration we see that in 8 out of 10 constituencies the net gain for Labour exceeded the national average of 4.4%, even in Finchley & Golders Green and Hendon. This was only enough to bring a Labour victory in 5 of these 10 constituencies, but the results were fairly close in some others and this raises hopes for Labour in future elections.
Of course we can’t say from these results much about the performance of the Jewish vote itself as that probably represented between 5% and 21% of the total for each constituency.
2. Jewish and other Ethnic Minority voting in these top 10 Jewish constituencies
In fact very little data is available on the voting patterns of ethnic minority or Jewish votes at a constituency level, but we can explore national shares for each party according to various surveys.
Surveys have indicated that whilst the average national share of the Labour vote in 2017 was 40%, there were large variations between different ethnic communities including the Jewish one.
National poll survey estimates for BAME, Muslim and Jewish voters are illustrated below (3, 4). It should be noted that the Muslim vote is largely included in the BAME category.
How different ethnic minorities voted in 2017
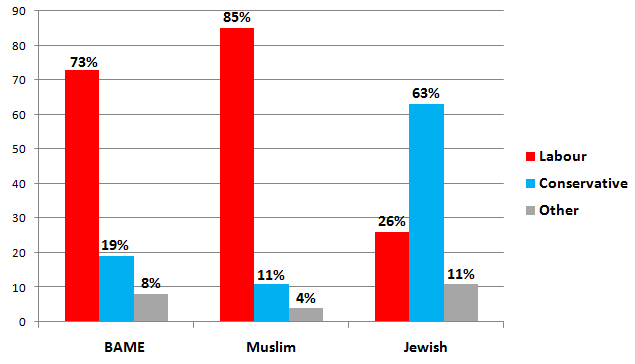
Both the BAME and Muslim vote shares for Labour are much higher than that for the Conservatives as can be seen above, and Labour’s BAME share increased between 2015 and 2017 from 65% to 73% (3).
In contrast, the Jewish national vote favours the Conservative Party. According to one poll, as illustrated above, the Labour vote from the Jewish community fell from an estimated 29% in 2015 to 26% in 2017 (4).
It was felt by some that Ed Miliband had lost much of the Jewish vote in 2015, some say because he wanted to recognise the state of Palestine, others that he was too critical of the Israeli bombing of Gaza in 2014.
However, it is generally thought that the Jewish population is slightly to the right of the general population which would partly explain the higher share given to the Conservatives. The perception that Corbyn is more left-wing than Miliband, is more supportive of Palestinian human rights, and the antisemitic attacks against him, may explain the loss of Labour share in 2017, which was a modest 3%.
We do not know how much the recent pre-election antisemitic attacks have damaged Labour’s electoral chances even further.
The composition of each constituency in terms of the different population shares, given such different voting patterns, will have a considerable local impact on the final outcome for each political party.
For the Top 10 Jewish constituencies analysed here, the ethnic minority population shares (5) are given below.
Ethnic minority population shares in the top 10 Jewish constituencies
Percentage of population
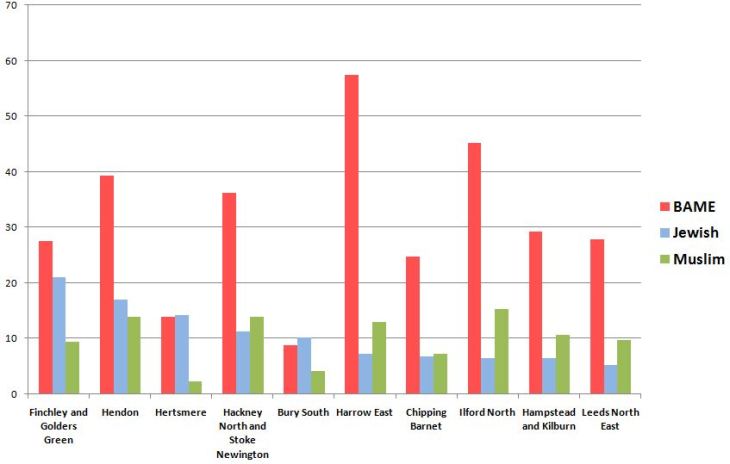
Interestingly, in many of these constituencies the BAME population share is greater than the Jewish one. But we should remember that the lower turnout of BAME voters will affect the actual voter shares.
3. The electoral implications for Labour
Labour had been increasing its net share of the vote from 2015 to 2017 by more than the national average in 8 of the 10 constituencies reviewed. Despite the antisemitism campaigns Labour had only lost 3% share of the Jewish vote nationally, whilst also increasing national vote shares from white and BAME voters.
It is difficult to predict the impact of recent events on Labour voting. The renewed aggressive antisemitic campaign may lead to more losses of the Jewish vote for Labour, and the Windrush scandal may lead to losses of the BAME Conservative vote. Other issues, such as the hardships of continued austerity, or the estimated extra 30 000 annual deaths probably related to NHS under-funding can influence all voters.
There is a strong moral argument to tackle antisemitism and racism every where we find it in our society. Discrimination and abuse have to be eliminated to ensure harmony (rather than hostility) and equality in our society for all, irrespective of race or religion.
The Labour Party will continue to tackle antisemitism and racism in its own ranks, and in our wider society. Labour will hopefully do well in these local elections, and with Jeremy Corbyn go on to win the next general election “for the many, not the few”.
References
- Results of the 2017 General Election – BBC News
http://www.bbc.com/news/election/2017/results/england
-
Election 2015 – BBC News
http://www.bbc.com/news/election/2017/results
-
How the voters voted in the 2017 election, Ipsos MORI, June 2017
https://www.ipsos.com/sites/default/files/2017-06/how-britain-voted-in-the-2017-election_1.pdf
-
Ben Clements, August 11th 2017 British Religion in Numbers
http://www.brin.ac.uk/2017/religious-affiliation-and-party-choice-at-the-2017-general-election/
-
ONS Data Catalogue for parliamentary constituencies, Constituency statistics, House of Commons Library
http://webarchive.nationalarchives.gov.uk/20160107183456/http://www.ons.gov.uk/ons/guide-method/user-guidance/parliamentary-constituencies/data-catalogue-for-parliamentary-constituencies/index.html


wow, that’s an impressive amount of data crunching!
LikeLiked by 1 person
Yes thanks, it was worth it I hope?
LikeLike